Improving management of aquatic invasions by integrating shipping network, ecological, and environmental data
ACM SIGKDD Conference on Knowledge Discovery and Data Mining (KDD 2014), New York, pp. 1699 to 1708 published
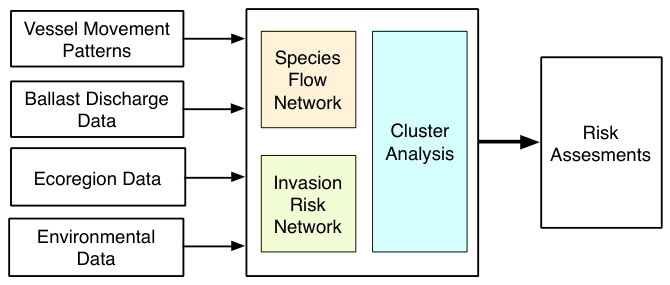
Ships carry stowaway plants and animals in their ballast water and on their hulls, and shipping causes most known aquatic invasions. Regulators with limited budgets need to know where control would do the most good. We combined ten years of global ship movements with ballast discharge records, ecoregion maps and port temperature and salinity into a network of likely species flow between ports. Clustering that network revealed a handful of port groups that stayed stable over the decade, joined by few links. A few hub ports carry much of the traffic between the groups: Singapore alone accounts for about a quarter of the flow into and out of the 818-port Pacific cluster. Targeting such hubs and links is an economical way to reduce invasions.
Abstract
The unintentional transport of invasive species (i.e., non-native and harmful species that adversely affect habitats and native species) through the Global Shipping Network (GSN) causes substantial losses to social and economic welfare (e.g., annual losses due to ship-borne invasions in the Laurentian Great Lakes is estimated to be as high as USD 800 million). Despite the huge negative impacts, management of such invasions remains challenging because of the complex processes that lead to species transport and establishment. Numerous difficulties associated with quantitative risk assessments (e.g., inadequate characterizations of invasion processes, lack of crucial data, large uncertainties associated with available data, etc.) have hampered the usefulness of such estimates in the task of supporting the authorities who are battling to manage invasions with limited resources.
We present here an approach for addressing the problem at hand via creative use of computational techniques and multiple data sources, thus illustrating how data mining can be used for solving crucial, yet very complex problems towards social good. By modeling implicit species exchanges as a network that we refer to as the Species Flow Network (SFN), large-scale species flow dynamics are studied via a graph clustering approach that decomposes the SFN into clusters of ports and inter-cluster connections. We then exploit this decomposition to discover crucial knowledge on how patterns in GSN affect aquatic invasions, and then illustrate how such knowledge can be used to devise effective and economical invasive species management strategies. By experimenting on actual GSN traffic data for years 1997-2006, we have discovered crucial knowledge that can significantly aid the management authorities.
What we found
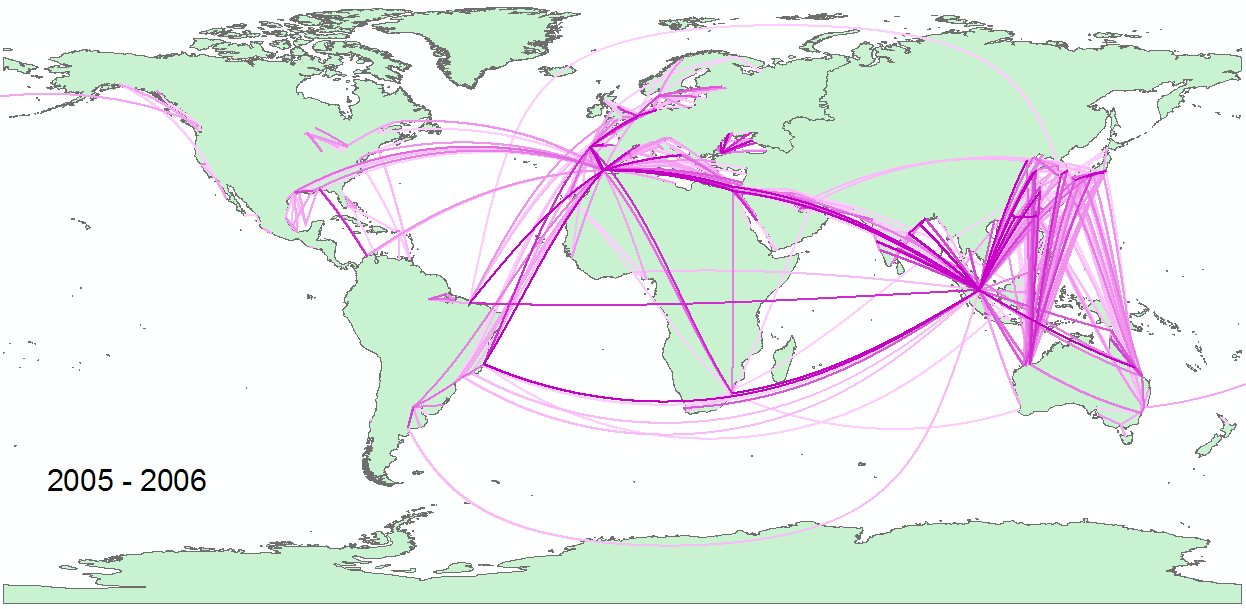
- Two stopovers reach almost anywhere. The species flow network links about 4,000 ports with roughly 150,000 routes, built from 6.9 million voyages by 50,487 vessels. Its average path length is about 3, so a species can reach nearly any port within two stopovers.
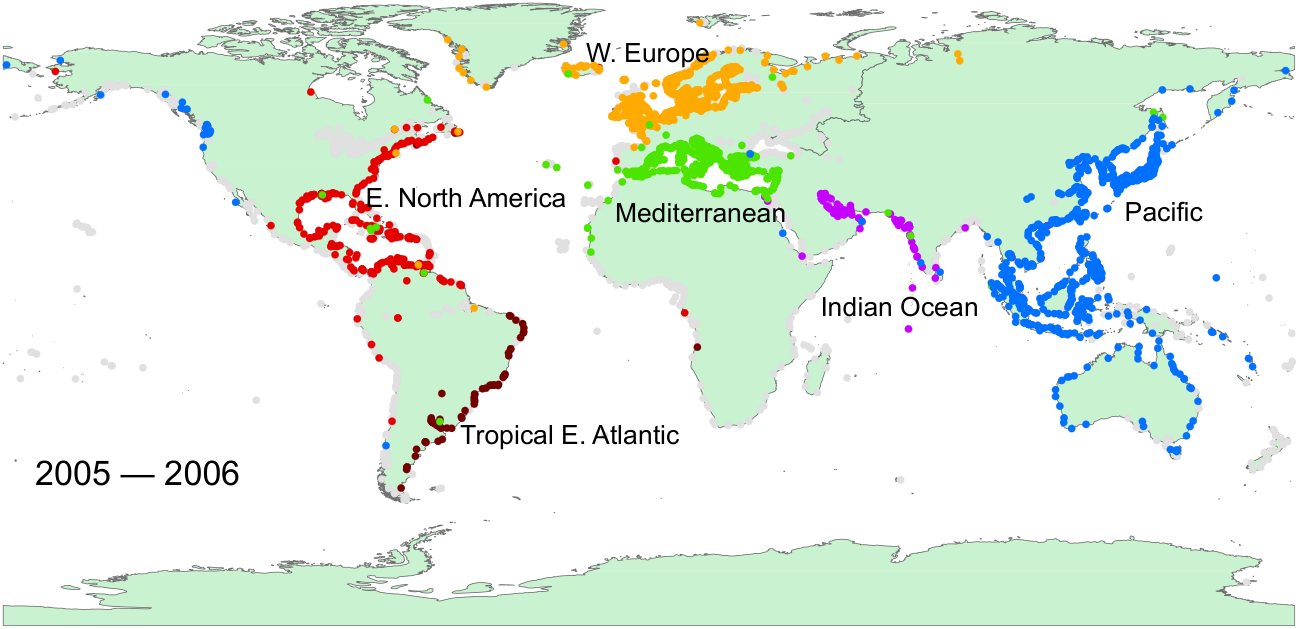
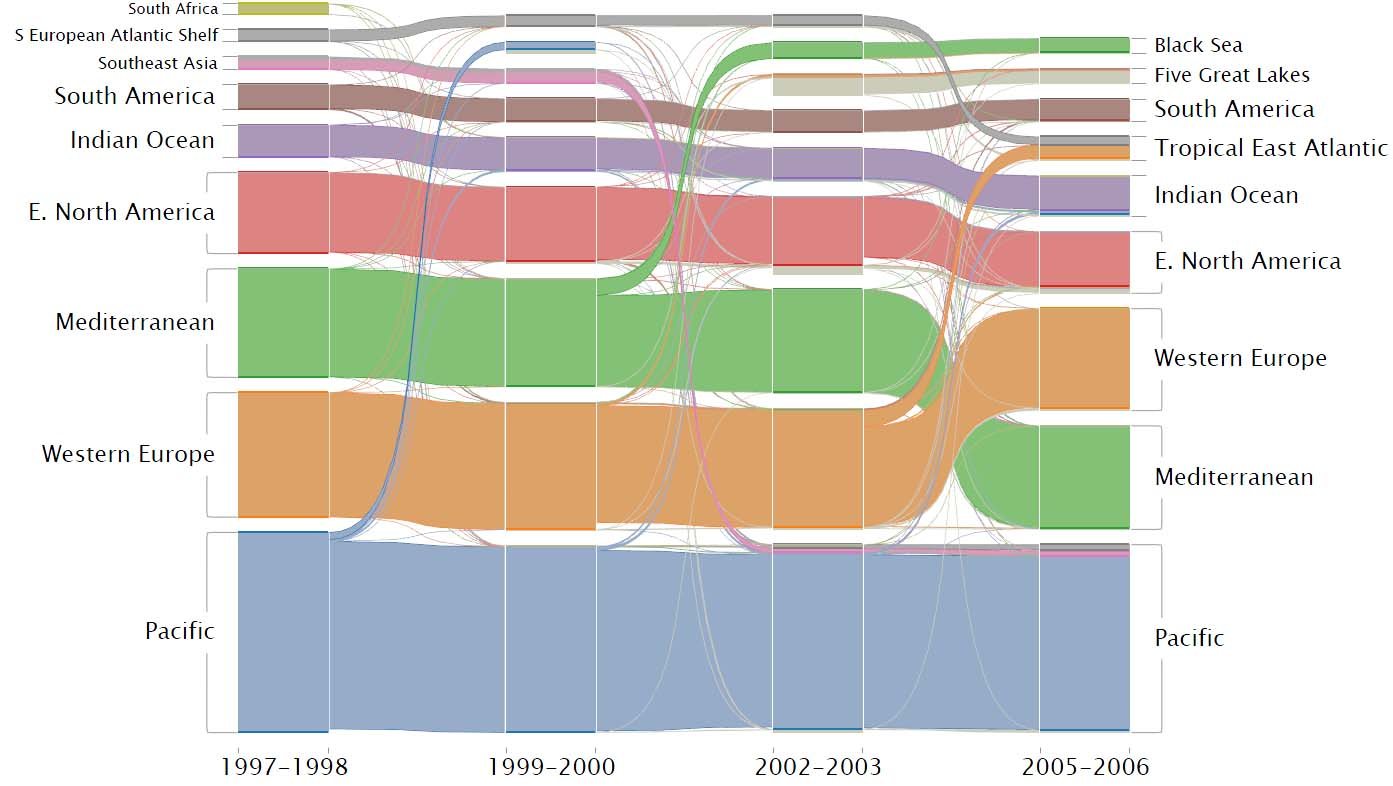
- A few stable clusters carry most of the flow. In 2005 to 2006, six of 64 clusters held 68.6% of ports and 76.3% of all species flow, and most ports stayed in the same cluster across the decade.
- Clusters track real events. In 1999 to 2000, 21 ports in California and Hawaii, including San Francisco, Los Angeles and San Diego, split off from the Pacific cluster into a cluster of their own.
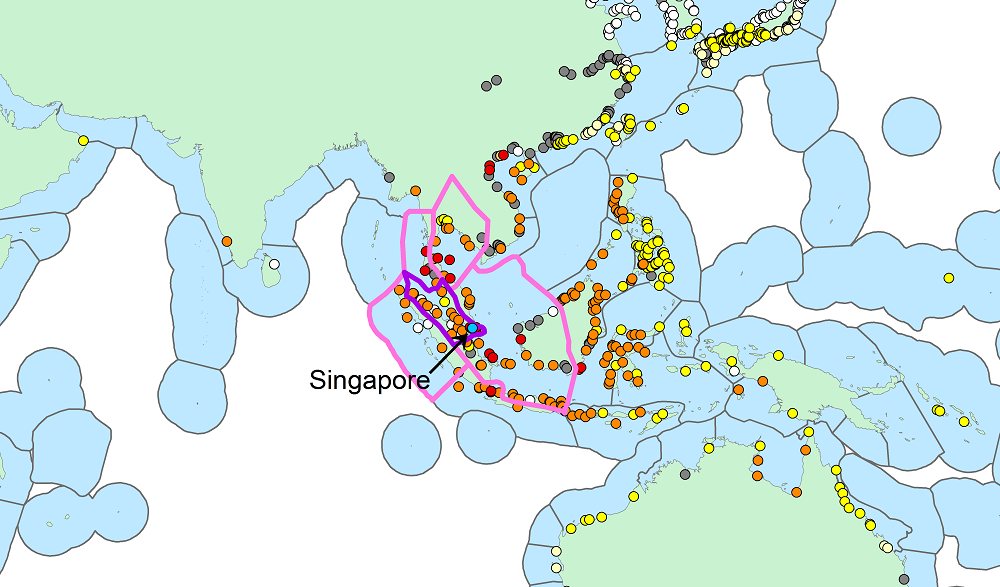
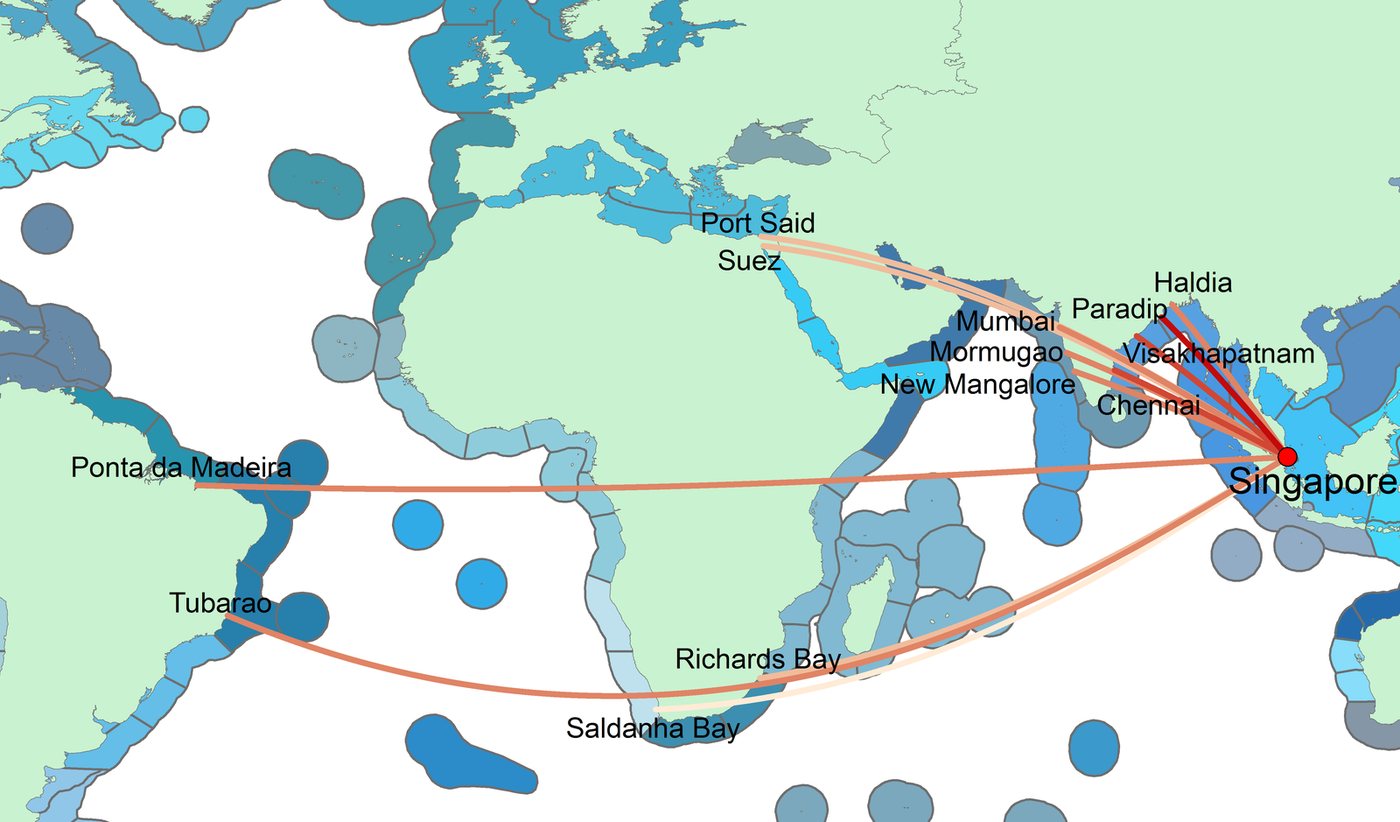
- Singapore dominates the Pacific cluster's outside traffic. The cluster has 37,596 connections to other clusters, yet Singapore alone carries about 26% of that flow, and every one of the strongest links starts or ends there.
- Protecting hubs doubles the distance. Cutting species flow at the 20% of ports with the most connections raises the average path length from about 3 to 6.4, making each introduction at least twice as hard.
- Ship types behave differently. Container carriers made 24% of all trips between clusters, while passenger ships stayed inside their cluster on 97.6% of trips.
Contributions
- A Species Flow Network that turns ship movements and estimated ballast discharge into a probability of introduction on each route, allowing for mortality during the voyage and for ballast management.
- Flow-based clustering of that network, tracked over ten years, to find port groups and the corridors between them.
- An Invasion Risk Network that scores each pair of ports by how many species tolerance groups could survive the move, using ecoregions rather than distance to define what counts as non-native.
- Concrete targets for management: hub ports, the top contributor in each major cluster, and the ship types that cross clusters most.
Figures
The larger project
The work continued in an NSF Coastal SEES project at Notre Dame on how changes in infrastructure, global trade, climate and policy affect ship-borne invasions, led by David Lodge with Nitesh Chawla. Both papers below came out of it. The first rebuilt the species flow network as a higher-order network.
Follow-up work
Cite
@inproceedings{xu2014improving,
  title     = {Improving management of aquatic invasions by integrating shipping network,
               ecological, and environmental data: data mining for social good},
  author    = {Xu, Jian and Wickramarathne, Thanuka L. and Chawla, Nitesh V. and Grey, Erin K.
               and Steinhaeuser, Karsten and Keller, Reuben P. and Drake, John M. and Lodge, David M.},
  booktitle = {Proceedings of the 20th ACM SIGKDD International Conference on Knowledge
               Discovery and Data Mining},
  pages     = {1699--1708},
  year      = {2014},
  publisher = {ACM},
  doi       = {10.1145/2623330.2623364}
}