HoNVis: visualizing and exploring higher‑order networks
IEEE Pacific Visualization Symposium (PacificVis 2017), Seoul, pp. 1 to 10 published
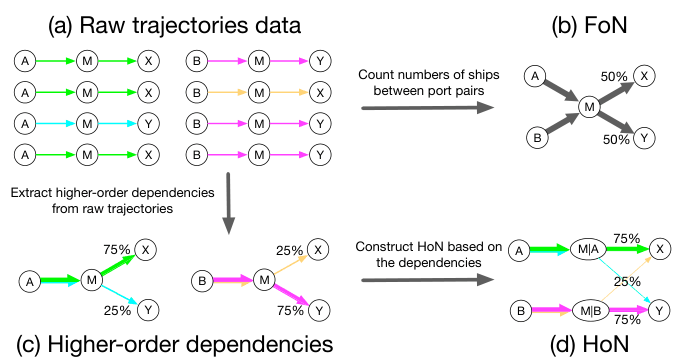
Where a ship sails next often depends on where it came from. A higher-order network captures this by splitting a port into several nodes, one for each history that matters, and a busy port can end up with tens to hundreds of them. No existing tool could show that. HoNVis is a visual analytics system built for it. Five linked views show where higher-order patterns occur on the map, how a ship's previous ports change its next stop, how an invasive species could spread step by step, and how flows look when ports are grouped into eco-regions. Two experts in species invasion used it on a year of global shipping and found patterns the ordinary network hides.
Abstract
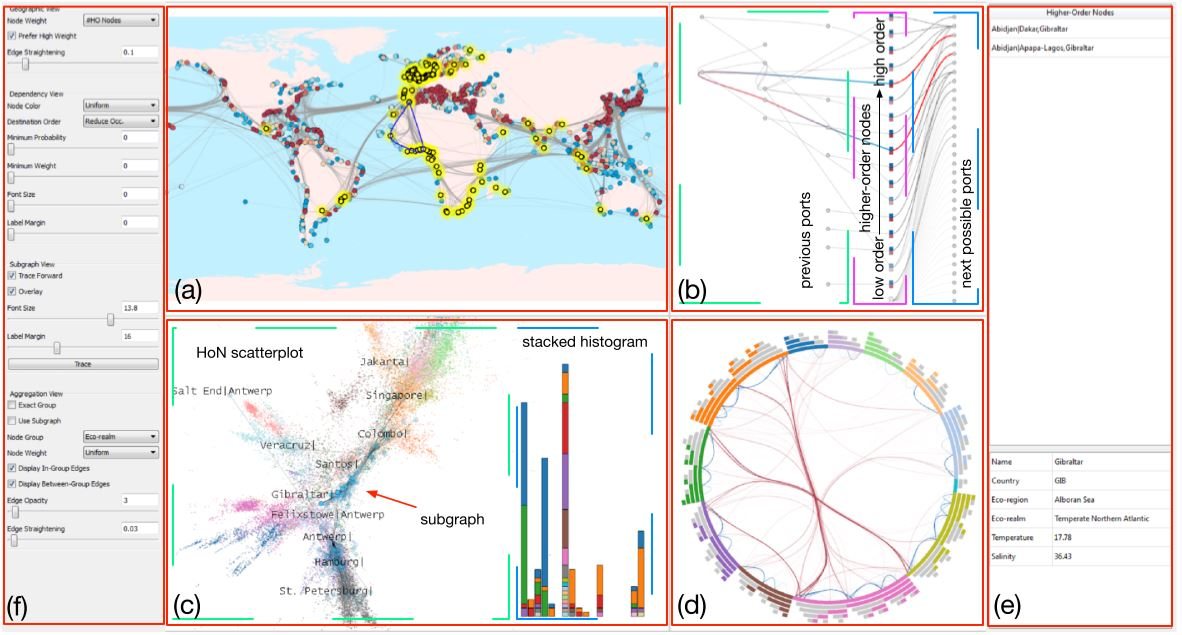
Unlike the conventional first-order network (FoN), the higher-order network (HoN) provides a more accurate description of transitions by creating additional nodes to encode higher-order dependencies. However, there exists no visualization and exploration tool for the HoN. For applications such as the development of strategies to control species invasion through global shipping which is known to exhibit higher-order dependencies, the existing FoN visualization tools are limited. In this paper, we present HoNVis, a novel visual analytics framework for exploring higher-order dependencies of the global ocean shipping network. Our framework leverages coordinated multiple views to reveal the network structure at three levels of detail (i.e., the global, local, and individual port levels). Users can quickly identify ports of interest at the global level and specify a port to investigate its higher-order nodes at the individual port level. Investigating a larger-scale impact is enabled through the exploration of HoN at the local level. Using the global ocean shipping network data, we demonstrate the effectiveness of our approach with a real-world use case conducted by domain experts specializing in species invasion. Finally, we discuss the generalizability of this framework to other real-world applications such as information diffusion in social networks and epidemic spreading through air transportation.
Why it matters
HoNVis took HON from a representation to something people can use. Before it, no tool could handle the rich information and complex dependencies in a higher-order network, which made patterns hard to find and harder to explain. HoNVis was the first system for exploring a higher-order network interactively: users import shipping, environmental and eco-region data, find the ports that matter, trace how a species could spread from them, and drill down to the voyages behind each dependency.
What the case study found
Lloyd's List data: 3.4 million voyages by 65,591 ships among 4,108 ports, May 2012 to April 2013.
- From hundreds of ports to tens. Coloring ports by their number of higher-order dependencies narrowed the candidates in South America from hundreds to tens and led the experts to Salvador, Brazil.
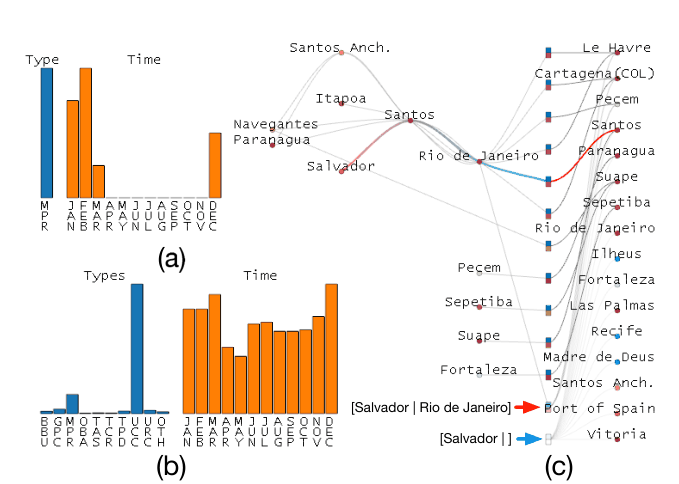
- A hidden loop at Salvador. Knowing only that a ship is at Salvador says little about its next port: it links weakly to 16. Ships that arrived via Santos and Rio de Janeiro instead repeat a fixed loop, and they are all cruise ships, active only from December to March.
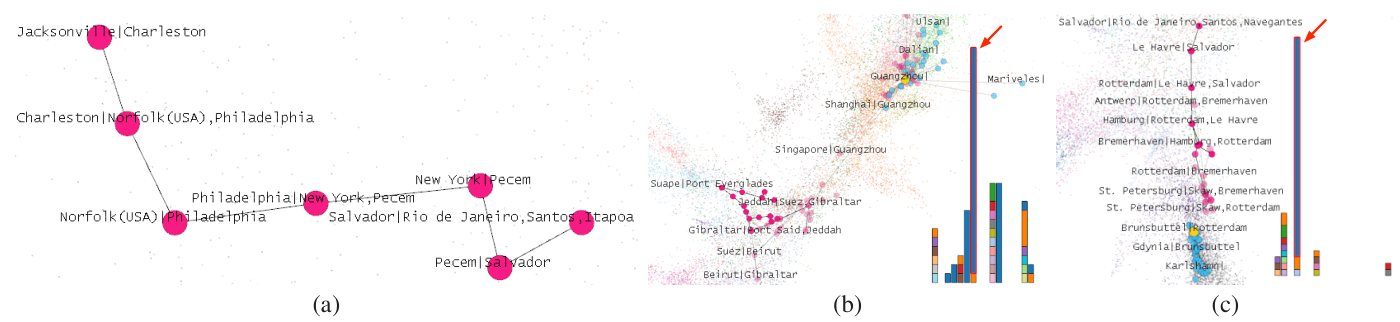
- Same port, different spread. Tracing a species forward from one Salvador history leads through New York to East Asia, entering at Guangzhou; another history leads to Northwest Europe through Brunsbüttel.
- A small target. Ships reaching the Tropical Atlantic from another eco-region tended to keep crossing eco-regions, all of them container carriers, but they were a small minority, so control could focus on a small share of ships and routes.
- Arctic risk overstated. The ordinary network rates several Arctic ports as high risk. On the higher-order network most come out lower: Murmansk falls from 4.52 × 10⁻⁴ to 1.57 × 10⁻⁴, because traffic from hubs like Rotterdam tends to return to the hub rather than move among Arctic ports.
Figures
Related work
Cite
@inproceedings{tao2017honvis,
  title     = {{HoNVis}: Visualizing and Exploring Higher-Order Networks},
  author    = {Tao, Jun and Xu, Jian and Wang, Chaoli and Chawla, Nitesh V.},
  booktitle = {2017 IEEE Pacific Visualization Symposium (PacificVis)},
  pages     = {1--10},
  year      = {2017},
  publisher = {IEEE},
  doi       = {10.1109/PACIFICVIS.2017.8031572}
}